Performance evolution of riffle
This is still in progress.
Optimization rules
- Try best to reduce the execution time in the lock wrapper
- Find out the hot point and then to optimize rather than guess
- Something maybe not executed as you think
Glommio grpc
This should be applied in the kernel version > 5.8
you can check this by the command of uname -r
Tracing
Using the fastrace to track the method invoking time, please don't use this in the criticial path.
Spin lock
Avoid using the spin lock, it will hurt the CPU ulization
IO multiplexing
todo
Improve the tonic's performance with large blocks
PR: https://github.com/hyperium/tonic/pull/1559
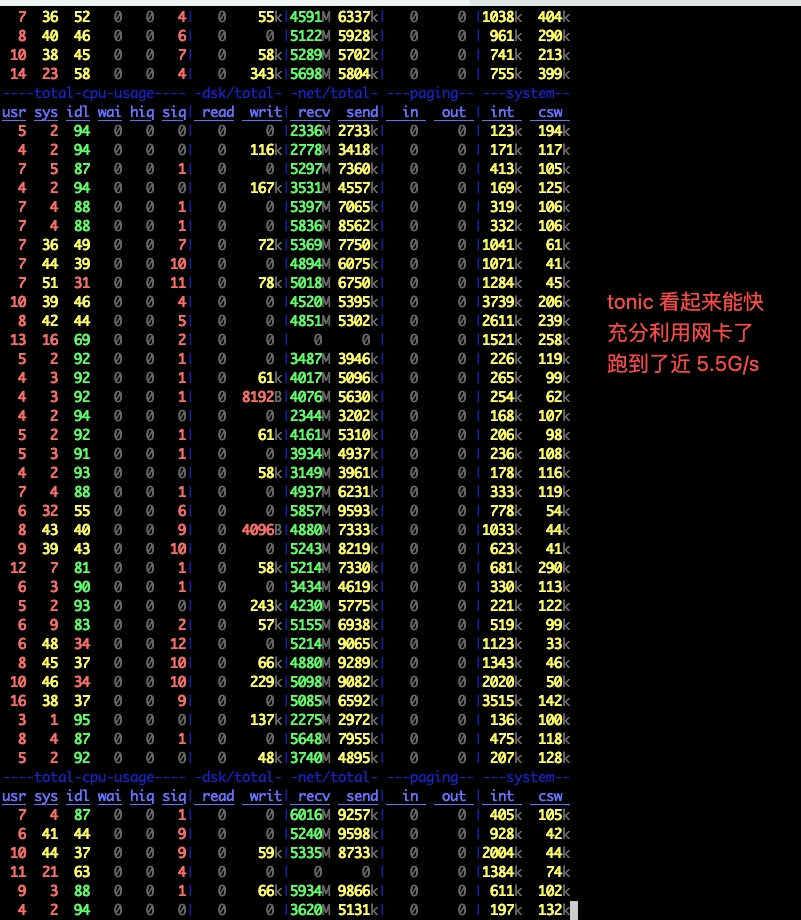
After applied above PR and to accept the huge data with 400 spark executors, the peek network speed reaches 5.5G/s
But I sample the framegraph by using the go tools to fetch (this test has removed the real inserting logic, that just accepted the data and then return the success), the hotpoint is the bytesMut.reserve_inner . this is strange. But the cost time reduce from 1.8min to 1.4min (-22%)
Anyway this is a good start.
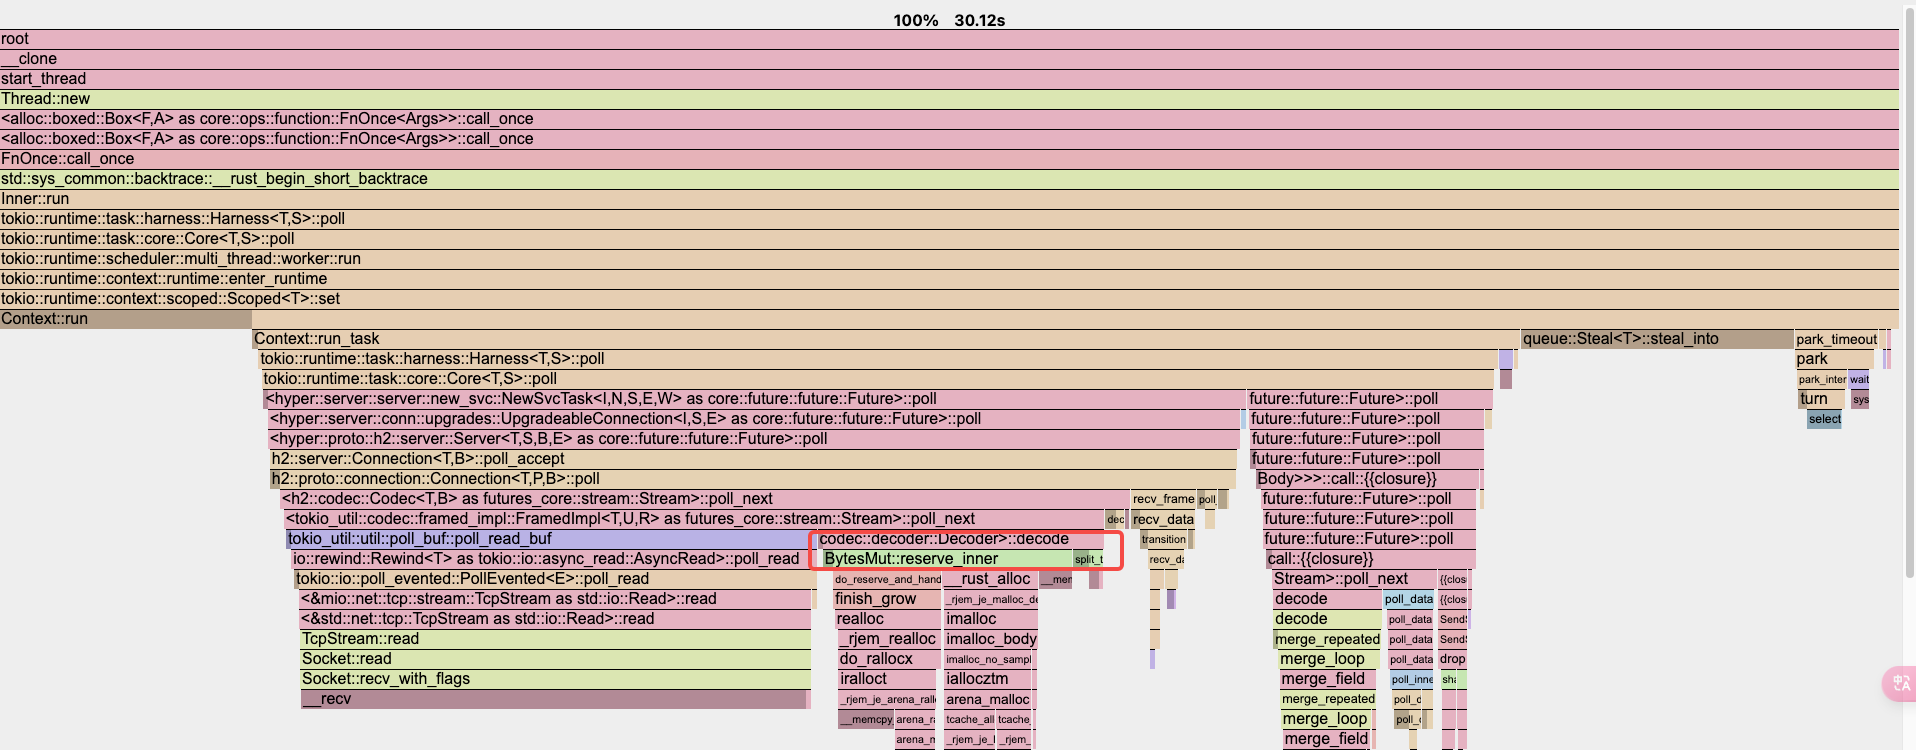
From this flamegrph, the ByteMut.reserve should not happen. I'm digging into the tonic codebase
After thinking a lot, I think this is caused by the incorrect proto. Let's read this proto design firstly.
message SendShuffleDataRequest {
	string appId = 1;
	int32 shuffleId = 2;
	int64 requireBufferId = 3;
	repeated ShuffleData shuffleData = 4;
	int64 timestamp = 5;
	int32 stageAttemptNumber = 6;
}

message ShuffleData {
	int32 partitionId = 1;
	repeated ShuffleBlock block = 2;
}

message ShuffleBlock {
	int64 blockId = 1;
	int32 length = 2;
	int32 uncompressLength = 3;
	int64 crc = 4;
	bytes data = 5;
	int64 taskAttemptId = 6;
}
From this proto, the data is hidden in the many list background. From the tonic above change, the huge contiginous bytes optimization will be not invalid. So the thing we need to do is to make it stored into the contiginous memory bytes. Let's change to the following.
message SendShuffleDataRequest {
	string appId = 1;
	int32 shuffleId = 2;
	int64 requireBufferId = 3;
	repeated ShuffleData shuffleData = 4;
	int64 timestamp = 5;
	int32 stageAttemptNumber = 6;
	bytes contiguousShuffleData = 7;
}

message ShuffleData {
	int32 partitionId = 1;
	repeated ShuffleBlock block = 2;
}

message ShuffleBlock {
	int64 blockId = 1;
	int32 length = 2;
	int32 uncompressLength = 3;
	int64 crc = 4;
	int64 taskAttemptId = 6;
}
All bytes will be appended into the one contigious bytes.
After this optimization, the time reduces from 1.4min to 1.0min (-28.5%), that is exciting.
And the average network speed is 4.5GB/s . It looks fine.
Memory buffer data structure
To avoid many mem allocation operations, I think it's necesary to append the accpeted bytes into the linkedlist.
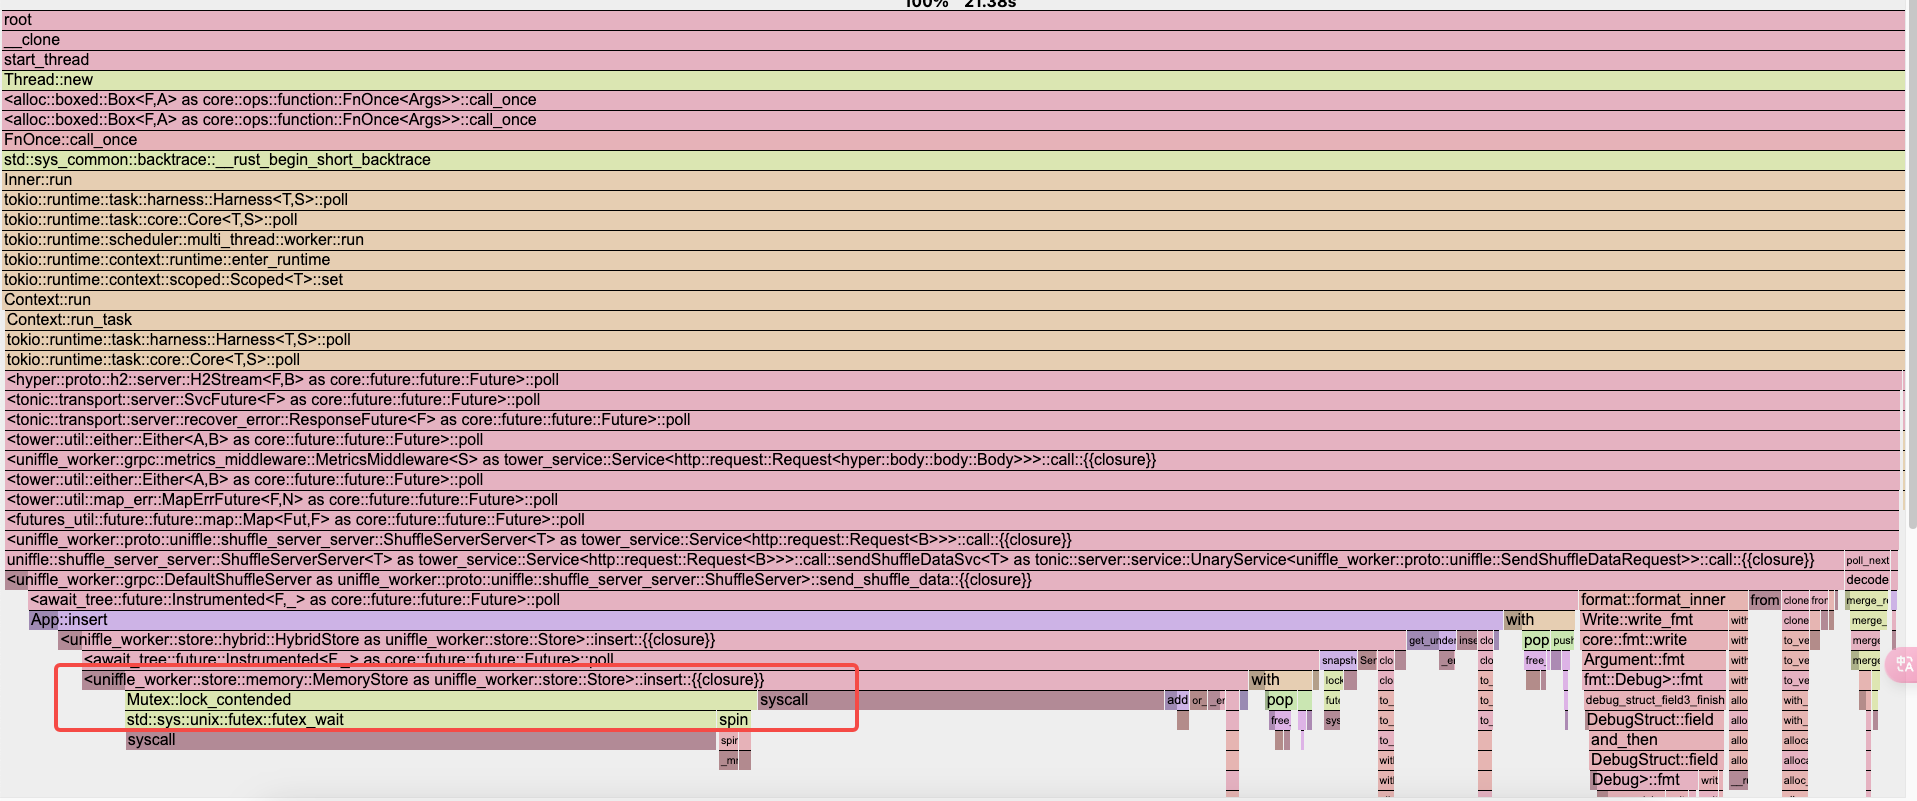
After avoiding any possible memory allocation, the write time costs 1.4min. (Compared with the previous 2min+), it looks good.
But from the flamegraph, the hotpoint represents the lock that occupy the too much cpu time. Maybe we can use the segment lock or others ?
Write with lock contention
To improve write throughput and reduce race condition, segment buffer could be introduced (flamegraph is as follows). And the cache line could be introduced.
This optimization could refer : https://mp.weixin.qq.com/s/NpUt_totq72n39m60YwIWQ
Segment buffer and lock
Segment lock is to reduce the too much concurrent conflict. However I didn't see any obvious improvement.
Cache line to acheive better L1 cache affinity
I haven't seen any improvement, as the inner object is too huge.
Memory -> Local disk flush
Local disk write
String clone elision
When avoid unnecessary clone, the performance improves 15%.